Hydrogen Spectrum Simulation
This simulation demonstrates the emission spectrum of atomic hydrogen, particularly the Balmer series. The spectrum consists of bright lines on a dark background, with each line corresponding to an electron transition between energy levels.
1/λ = R(1/2² - 1/n²) where n = 3,4,5,...
Adjust the controls below to explore different aspects of the hydrogen spectrum.
Current value: 3
Current value: 50%
About the Balmer Series
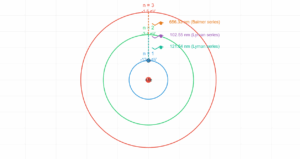
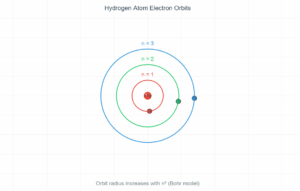
The Balmer series is the set of spectral lines in the visible spectrum of hydrogen, resulting from electron transitions from higher energy levels (n ≥ 3) down to the n=2 level.
The wavelengths can be calculated using the Balmer formula shown above, where R is the Rydberg constant (1.097 × 10⁷ m⁻¹).
The first three lines in the series are:
- Hα (n=3→2): 656.3 nm (red)
- Hβ (n=4→2): 486.1 nm (blue-green)
- Hγ (n=5→2): 434.1 nm (violet)