Position-Time Graph Interpretation
Explanation
Physics Analysis
Understanding Position-Time Graphs
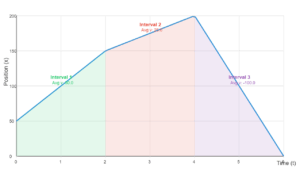
The graph shows position (x) vs time (t) for a particle. For t < 0, the graph is linear (constant velocity). For t > 0, the graph is parabolic (constant acceleration).
Important: The x-t graph does NOT show the actual path of the particle. It only shows how the particle's position changes over time.
A suitable physical context would be a particle moving along a straight line with constant velocity, then experiencing constant acceleration (like a car moving at steady speed, then pressing the accelerator).
Physics Analysis
For t < 0:
- Linear x-t relationship: x = vt + x₀
- Constant velocity (slope of the line)
- Zero acceleration
For t > 0:
- Quadratic x-t relationship: x = ½at² + v₀t + x₀
- Changing velocity (slope changes)
- Constant acceleration (curvature of parabola)