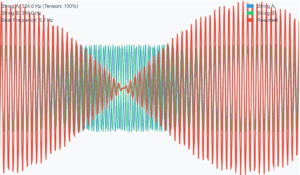
Wave Displacement vs Time Graphs
This simulation shows displacement-time graphs at different positions for a traveling wave.
Question 9: For the wave described:
y(x, t) = 3 sin(36t + 0.018x + π/4)
Plot y vs t graphs for x = 0, 2, and 4 cm and analyze the oscillatory motion.
x = 0 cm
x = 2 cm
x = 4 cm
Value: 5.0 s
Points: 50
Analysis
Three sine waves with identical amplitude and frequency but different phases.
Key Observations:
- All points oscillate with the same amplitude (3 cm)
- All points oscillate with the same frequency (36 rad/s)
- Points differ only in their phase due to their positions


